About the project
The product that I was working on was called PAN or Product Activity Notice which is an internal tool used by teams to assess, maintain, visualize, track, and plan any and all product production or manufacturing for loaders, movers, graders, dozers, and all heavy equipment on a global scale.
The design process included research with SMEs across many time zones, discovering & defining the problem, concept design & validation, wireframing, low-to-high fidelity prototypes, and future design & development cycles.
The entire process took about nine months through many design challenges and iterations. The team was wonderful with extensive collaboration and commitment.
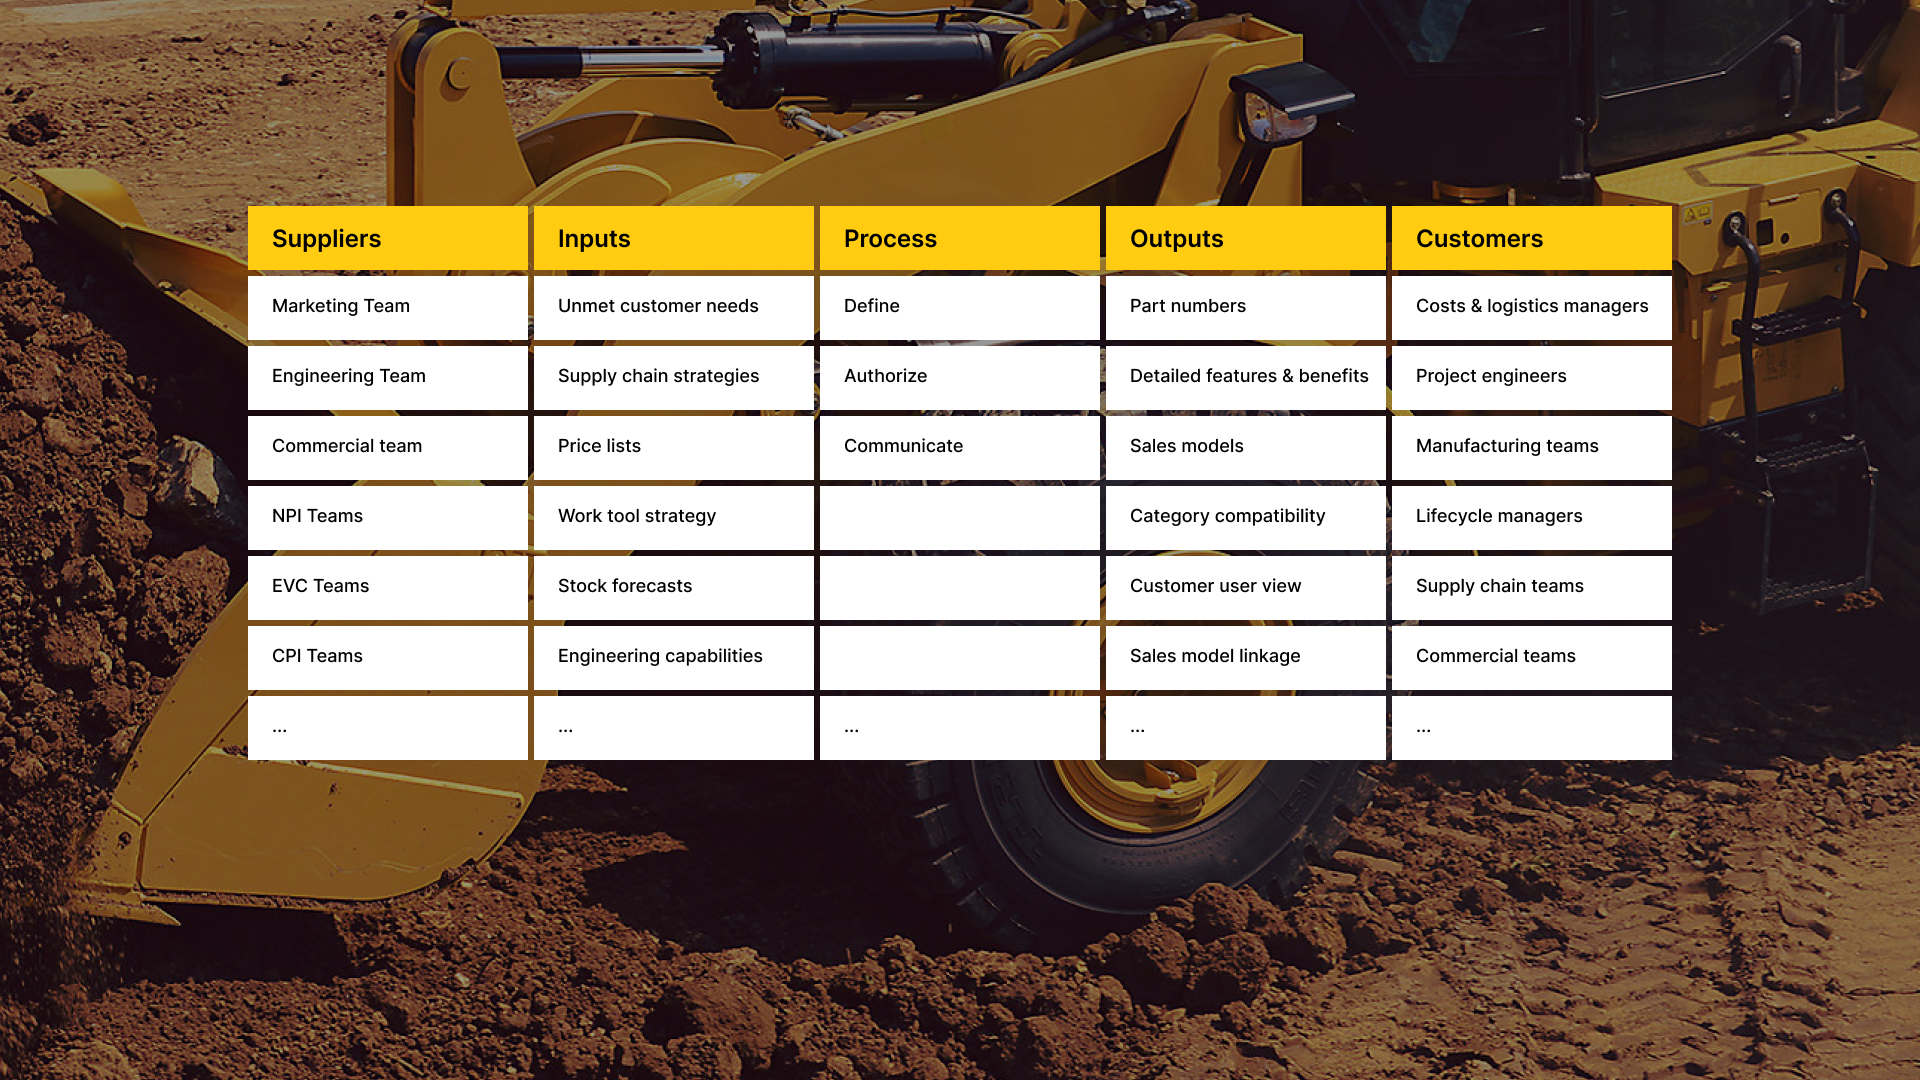
What is SIPOC?
SIPOC helps us understand the entire problem and is part of the lean manufacturing methodology that Caterpillar follows. Understanding SIPOC will help piece together all the different challenges that the team is facing.
The following suppliers: marketing, engineering and commercial teams are providing the different inputs of; unmet customer needs, supply chain strategies, and price lists, into the define, authorize, and communicate processes which result in the outputs of detailed features and benefits, part numbers, and sales models, for our Customers including; cost and logistics managers, project engineers and manufacturing teams
The Problem
Equipment Managers and Project Engineers within multiple product groups are using antiquated spreadsheets and other forms of data collection, which are not suitable for analysis and distribution, with some files containing over 25,000 cells of data, which requires a massive amount of time to perform data searches, align with collaborating teams, and execute tasks. Plus, there are over 40 unique types of files containing different references to the same equipment and products which wastes a manager’s time, creates a risk to under-forecasting, and is extremely frustrating to use.
Strategy
Our strategy consisted of defining our vision, aligning on goals, and structuring our step-by-step plan for success. Where do we want to go and why do we want to go there?
The vision that we had for the product was to migrate away from a disjointed system and into the cloud, create an Interactive UI with search functionality and customizable views, improve the organizational structure of data, allow access from anywhere with any device, and the ability to integrate with current or future systems.
Our goal for a successful product will allow all product teams the ability to use the tool and authorize everything within the pipeline, to have all necessary data live in a singular solution, and to edit and maintain live documents while mitigating the significant differences between roles, process flows, product offerings and markets served.
Process - Artifacts & activities for Research & Design
Understanding the problem space - Discussion guide, Test plan, Research sessions, User insights, Research highlights, Journey map
Research Insights
To gather our research insights, we wanted to learn from the SME’s and listen to their perspective of the problem, facilitate the team to align on the most critical user-centric problem, and create HMWs & the journey map
Thematic Analysis
Based off our research sessions we were able to analyze and synthesize our collective notes into the following themes
Journey map
Our journey map revealed numerous valuable insights and opportunities for our users, but most were cost prohibitive, so we narrowed our focus and conducted tests on the select few that were prioritized by the team.
User Flows & Wireframes
The following is a small sample of user flows, sub-flows and wireframes, encompassing multiple tasks, interactions, and specified features.
Design
The design comprises several distinct views, with three examples highlighted below:
Table Customization: Users can adjust table density ranging from micro to macro for improved visibility, show/hide columns of data, and personalize the multi-row headers in the "Settings" menu to suit their preferences.
Filters: Select, customize, filter data in and out from multiple data points.
Interactive Manual Input Cells: Manual input cells are not only selectable but also fully customizable.
In addition to these examples, the design offers various features, such as merging rows of data within categories or sub-categories, real-time data updates, tooltips which provide definitions for all database abbreviations, enhancing user understanding, notes feature in every view allowing users to read, edit, save, and delete notes, a real-time toggle between percentages and numbers, the option to collapse, expand, or add multiple columns, and the capability to create new views based on specified criteria.


